Weakly electric fish generate weak (<1 V/cm) high frequency (0.1-10 kHz) electric fields which they use to locate and identify nearby objects and to communicate with other electric fish. We have measured with a robotic microvoltmeter the electric organ discharges (EODs) of these fish at high temporal and spatial resolution. We have assembled the EOD measurements as pseudocolor QuickTime movies, with light blue representing zero; green - yellow - red represent successively greater positive values; and blue - dark blue - violet representing successively negative values of the potential and field magnitude. Because the magnitudes vary over several orders of magnitude from near the tail to the far field, the color scale saturates (red and violet) or clips the peaks, so finer details of the far field structure are apparent.
The movies are shown in very slow "motion". If your computer is fast enough to show them at their programmed frame rate, then the Apteronotus leptorhynchus potential movie is shown at 1/4000 the actual EOD rate; A. albifrons is slowed to 1/5000 actual rate; and Eigenmannia is slowed by 1/1500.
An electric fish was immobilized and placed in the center of the fish tank on a respirator. An array of 5 tiny (200 micron diameter) silver ball electrodes attached to an analog x-y plotter was repeatedly positioned by computer control at hundreds of locations around the fish. At each location, the electric organ discharge waveforms were digitized at 48,000 16 bit samples/second/channel. The EOD from a stationary electrode was simultaneously digitized on another channel and used as a phase reference and to monitor EOD stability. Electrode locations were measured using a computer-video chroma keying system. After recording waveforms at hundreds of points, the voltage measurements were digitally filtered, temporally aligned with each other, spatially interpolated, and rendered in pseudocolor. The movies below each result from the order of 5 million voltage measurements followed by some 100 million floating point operations. The work was done with a Macintosh IIfx computer using custom hardware, MATLAB, and custom software. The fish recovered from the anesthesia unharmed. Further details can be found in our publications.
For additional information or questions, please contact us. And enjoy the movies!
Brian Rasnow, brasnow@amgen.comThe following movies are available in two formats. The files with .hqx extensions are in QuickTime (TM) format and are converted to an ASCII form using BinHex. The second format available is a flattened QuickTime (TM) movie for use on computers other than Macintosh. For information on how to view these movies on various computer platforms, see the page entitled "How to view QuickTime (TM) movies."
A brief description and a reduced size JPEG image of one of the frames is given below for each of the movies available. Clicking on the images will take you to a full size version of that particular movie frame.
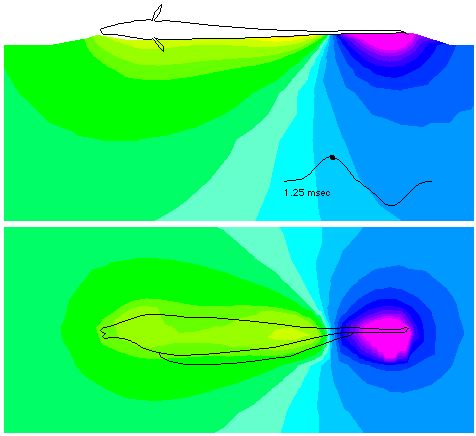
The top is a view looking down at the fish's midplane; bottom shows the potential in the vertical plane & on the fish's skin. The latter was measured with flexible electrodes. The assymetry below the tail is an interpolation artifact due to low density of measurement points in this region. The inset shows the waveform recorded between two electrodes approximately 8 cm in front of the head and behind the tail, the dot shows the instantaneous phase. In contrast to a simple dipole, the peaks and zero crossings propagate caudally along the body, suggesting that segments of the electric organ are active sequentially instead of synchronously. The velocity of the peaks, approximately 5.10 cm/msec, is consistent with the expected conduction velocity of the spinal relay axons driving the electric organ. The fact that local peaks are present along the body suggests the electric organ "leaks" current radially out its sides, and is not perfectly insulated to just channel current out its ends.
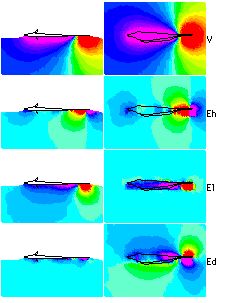
The left and right columns show the midplane and dorsoventral planes respectively. The top row shows the potential (as in the file: A.leptorhynchus), and successive rows show the simultaneously measured electric field components in directions headward (Eh), lateral of the left side (El), and dorsal (Ed). The electric field is oriented perpendicular to the equipotentials so near the head, the field always points radially towards and away from the fish. However, in the caudal 50-75 percent of the fish, the equipotential surfaces and thus the field, change orientation as the EOD propagates. The field vector rotation might facilitate depth perception for active electrolocation, by revealing different cross sections of objects with different field orientation. This is somewhat analogous to an object casting different shadows when illuminated from different angles.
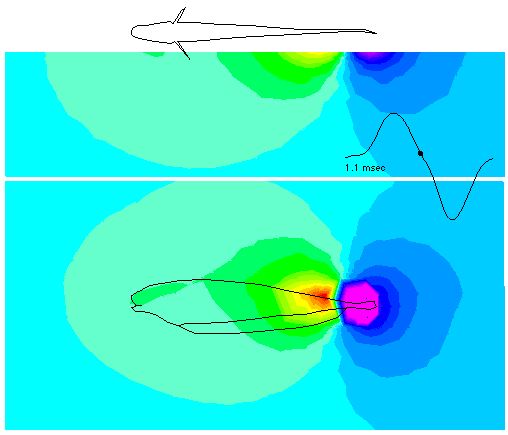
This young A. albifrons has a surprisingly similar EOD pattern as the larger A. leptorhynchus. The most notable difference was it's higher EOD frequency (920 Hz).
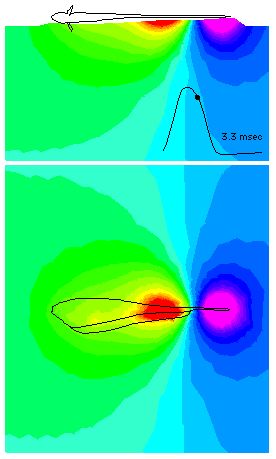
Eigenmannia virescens is the only species we have mapped that has a simple EOD resembling an oscillating dipole. It is also the lowest frequency fish we have studied, with fundamental frequency of 300 Hz. Waveforms rostral to a stationary "zero plane" near the longitudinal midpoint of the electric organ are in phase with each other and are inverted or 180 degrees out of phase with caudal waveforms. Activation along the length of the electric organ is synchronized, implying the electrocytes fire in unison. Physiological and anatomical studies have shown that electromotor axons that project to anterior electric organ segments are thinner and slower than those projecting to posterior segments. Apparently path length compensation works well in this low frequency fish. The EOD amplitude peaks also reveal the ventral location of Eigenmannia's electric organ.
Amidst its uniform field, Eigenmannia exhibits an exceptional social behavior called the jamming avoidance response or JAR, which shifts the fish's frequency away from a superimposed jamming signal. The JAR requires detailed comparisons of spatio-temporal information across different regions of the body surface, with performance proportional to the surface area. However, in other wave fish with variable local field waveforms, the effects of a jamming signal change with location on the body, possibly making direct comparisons across large regions more difficult. Perhaps for this reason Apteronotus has a relatively poor JAR, tending to only increase in frequency or phaselock with a jamming signal.