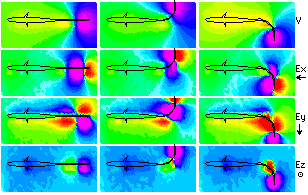
Tail bending is an important exploratory behavior. Measurements and simulations of the electric field during tail bending are shown below.
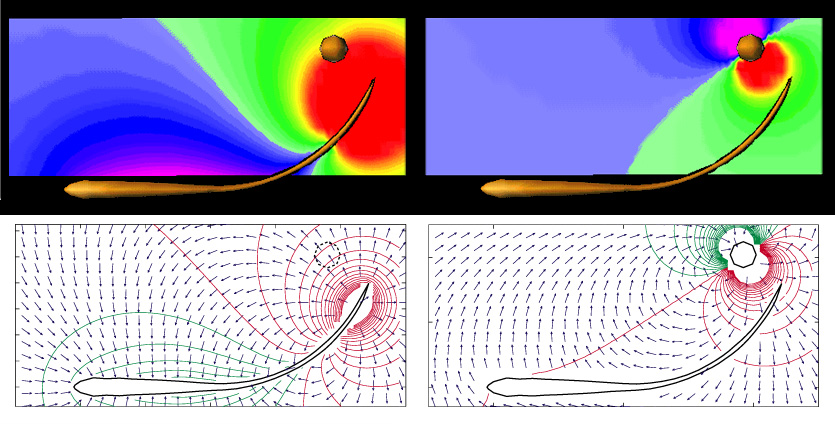
This is a simulation adapted from a tailbending probing behavior recorded by Behrend in 1984 (Neuroscience 13:171-178). The EOD is shown in a cross-section through the midplane of the fish. The left-top frame depicts the head-negative peak of the EOD, with the rainbow color scale ranging from purple (<= -10 mV) to red (>=10 mV), and the lightest blue at 0 mV. The right-top frame shows the difference that the object makes when we subtract the field simulated without the object from the field with the object present. The object's effect can clearly be seen as an induced dipole field. (The potential difference has been magnified by a factor of 100 to make it visible on this color scale.) The lower frames are the same data displayed with potential contours, and normalized vectors indicating current direction.
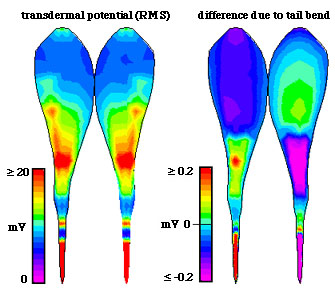 The electroreceptors of the fish, which are found throughout its skin,
measure the voltage drop across the skin, called the "transdermal potential".
To visualize the pattern of electrosensory stimuli, the skin of the model fish
was "peeled" and "flattened" (see schematic on
simulations page) and the simulation results mapped
to this flattened surface. In this figure, the RMS transdermal potential is
shown for the normal EOD when the tail is straight (left). This represents the
EOD envelope encoded by the P-type amplitude receptors. When the tail is
bent, as in the figure above, the transdermal potential pattern changes by the
amount shown on the right. In the front half of the body where most of the
receptors are found, the stimulus is larger on the side of the tail bend and
smaller on the side away from the bend. However, the differences are only a
few percent of the overall EOD (note the scale is magnified).
We are also now studying
the difference the object makes in the currents across the skin, where the
fish has its receptors. Our preliminary results show that small objects,
such as the one above, cause distortions that may be much smaller in magnitude
than the changes due to tail bending alone.
So the fish has a problem to solve: how does it detect the tiny distortion
caused by a small object, and distinguish it from larger tail-bending effects?
The electroreceptors of the fish, which are found throughout its skin,
measure the voltage drop across the skin, called the "transdermal potential".
To visualize the pattern of electrosensory stimuli, the skin of the model fish
was "peeled" and "flattened" (see schematic on
simulations page) and the simulation results mapped
to this flattened surface. In this figure, the RMS transdermal potential is
shown for the normal EOD when the tail is straight (left). This represents the
EOD envelope encoded by the P-type amplitude receptors. When the tail is
bent, as in the figure above, the transdermal potential pattern changes by the
amount shown on the right. In the front half of the body where most of the
receptors are found, the stimulus is larger on the side of the tail bend and
smaller on the side away from the bend. However, the differences are only a
few percent of the overall EOD (note the scale is magnified).
We are also now studying
the difference the object makes in the currents across the skin, where the
fish has its receptors. Our preliminary results show that small objects,
such as the one above, cause distortions that may be much smaller in magnitude
than the changes due to tail bending alone.
So the fish has a problem to solve: how does it detect the tiny distortion
caused by a small object, and distinguish it from larger tail-bending effects?