Spectra of bright objects
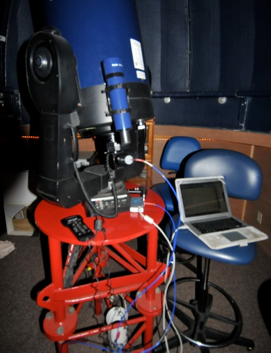
Fiber coupled Ocean Optics USB4000 spectrometer with 200 um slit (estimated resolution ~7.5nm), stuck in old 35mm film box at prime focus of 14” f/10 LX200. OA Overture v1.0.1 software on Windows 7 under Parallels on MBA.
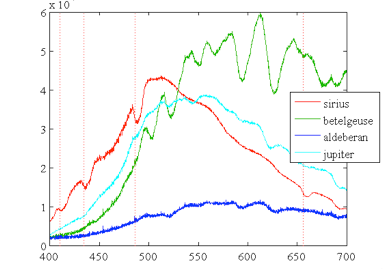
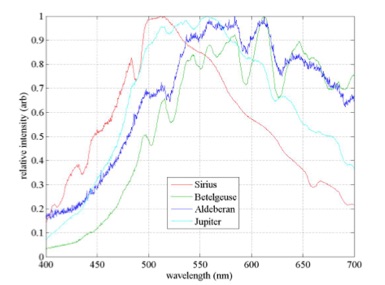
Raw and peak-normalized spectra reveal temperatures of the light sources, and absorption bands from colder intervening atoms and molecules.
Sirius has the bluest peak (hottest), and shows hydrogen Balmer absorption lines. The red giants have more absorption lines indicating more species of atoms and molecules in their atmospheres (e.g., 589nm is Na, Mg ~520nm.